The economy of India is a developing mixed economy with a notable public sector in strategic sectors. It is the world's fifth-largest economy by nominal GDP and the third-largest by purchasing power parity (PPP); on a per capita income basis, India ranked 141th by GDP (nominal) and 125th by GDP (PPP). From independence in 1947 until 1991, successive governments followed the Soviet model and promoted protectionist economic policies, with extensive Sovietization, state intervention, demand-side economics, natural resources, bureaucrat-driven enterprises and economic regulation. This is characterised as dirigism, in the form of the Licence Raj.The end of the Cold War and an acute balance of payments crisis in 1991 led to the adoption of a broad economic liberalisation in India and indicative planning. India has about 1,900 public sector companies, with the Indian state having complete control and ownership of railways and highways. The Indian government has major control over banking,insurance,farming, fertilizers and chemicals,airports,defense, essential utilities, and the energy sector.The state also exerts substantial control over digitalization, broadband as national infrastructure, telecommunication, supercomputing, space, port and shipping industries,which were effectively nationalised in the mid-1950s but has seen the emergence of key corporate players.
Nearly 70% of India's GDP is driven by domestic consumption;country remains the world's fourth-largest consumer market. Aside private consumption, India's GDP is also fueled by government spending, investments, and exports.In 2022, India was the world's 10th-largest importer and the 8th-largest exporter.India has been a member of the World Trade Organization since 1 January 1995. It ranks 63rd on the ease of doing business index and 40th on the Global Competitiveness Index. India has one of the world's highest number of billionaires along with extreme income inequality.Economists and social scientists often consider India a welfare state.India is officially declared a socialist state as per the constitution. India's overall social welfare spending stood at 8.6% of GDP in 2021-22, which is much lower than the average for OECD nations. With 586 million workers, the Indian labour force is the world's second-largest.Despite having one of the longest working hours, India has one of the lowest workforce productivity levels in the world.Economists say that due to structural economic problems, India is experiencing jobless economic growth.
During the Great Recession, the economy faced a mild slowdown. India endorsed Keynesian policy and initiated stimulus measures (both fiscal and monetary) to boost growth and generate demand. In subsequent years, economic growth revived.
In 2021–22, the foreign direct investment (FDI) in India was $82 billion. The leading sectors for FDI inflows were the Finance, Banking, Insurance and R&D. India has free trade agreements with several nations and blocs, including ASEAN, SAFTA, Mercosur, South Korea, Japan, Australia, the United Arab Emirates, and several others which are in effect or under negotiating stage. In recent years, independent economists and financial institutions have accused the government of manipulating various economic data, especially GDP growth rate.
The service sector makes up more than 50% of GDP and remains the fastest growing sector, while the industrial sector and the agricultural sector employs a majority of the labor force. The Bombay Stock Exchange and National Stock Exchange are some of the world's largest stock exchanges by market capitalisation. India is the world's sixth-largest manufacturer, representing 2.6% of global manufacturing output. Nearly 65% of India's population is rural, and contributes about 50% of India's GDP. India faces high unemployment, rising income inequality, and a drop in aggregate demand. According to the World Bank, 93% of India's population lived on less than $10 per day, and 99% lived on less than $20 per day in 2021. According to a 2021 report by the Pew Research Center, India has roughly 1.2 billion lower-income individuals, 66 million middle-income individuals, 16 million upper-middle-income individuals, and barely 2 million in the high-income group. As per The Economist, 78 million of India's population are considered middle class as of 2017, if defined using the cutoff of those making more than $10 per day, a standard used by the India's National Council of Applied Economic Research. India's gross domestic savings rate stood at 29.3% of GDP in 2022.
History:
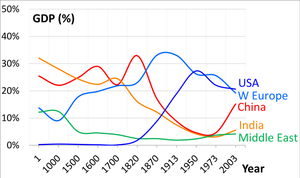
For a continuous duration of nearly 1700 years from the year 1 CE, India was the world's largest economy, constituting 35 to 40% of the world GDP.[111] The combination of protectionist, import-substitution, Fabian socialism, and social democratic-inspired policies governed India for sometime after the end of British rule. The economy was then characterised as Dirigism,[63][64] It had extensive regulation, protectionism, public ownership of large monopolies, pervasive corruption and slow growth.[65][66][112] Since 1991, continuing economic liberalisation has moved the country towards a market-based economy.[65][66] By 2008, India had established itself as one of the world's faster-growing economies.
Ancient and medieval eras
Indus Valley Civilisation
The citizens of the Indus Valley civilisation, a permanent settlement that flourished between 2800 BCE and 1800 BCE, practised agriculture, domesticated animals, used uniform weights and measures, made tools and weapons, and traded with other cities. Evidence of well-planned streets, a drainage system, and water supply reveals their knowledge of urban planning, which included the first-known urban sanitation systems and the existence of a form of municipal government.[113]
West Coast
Maritime trade was carried out extensively between southern regions of India and Southeast Asia and West Asia from early times until around the fourteenth century CE. Both the Malabar and Coromandel Coasts were the sites of important trading centres from as early as the first century BCE, used for import and export as well as transit points between the Mediterranean region and southeast Asia.[114] Over time, traders organised themselves into associations which received state patronage. This state patronage for overseas trade came to an end by the thirteenth century CE, when it was largely taken over by the local Parsi, Jewish, Syrian Christian, and Muslim communities, initially on the Malabar and subsequently on the Coromandel coast.[115]
Silk Route
Other scholars suggest trading from India to West Asia and Eastern Europe was active between the 14th and 18th centuries. During this period, Indian traders settled in Surakhani, a suburb of greater Baku, Azerbaijan. These traders built a Hindu temple, which suggests commerce was active and prosperous for Indians by the 17th century.
Further north, the Saurashtra and Bengal coasts played an important role in maritime trade, and the Gangetic plains and the Indus valley housed several centres of river-borne commerce. Most overland trade was carried out via the Khyber Pass connecting the Punjab region with Afghanistan and onward to the Middle East and Central Asia.[123] Although many kingdoms and rulers issued coins, barter was prevalent. Villages paid a portion of their agricultural produce as revenue to the rulers, while their craftsmen received a part of the crops at harvest time for their services.[124]
Mughal, Rajput, and Maratha eras (1526–1820)
The Indian economy was the largest and most prosperous throughout world history and would continue to be under the Mughal Empire, up until the 18th century.[125] Sean Harkin estimates that China and India may have accounted for 60 to 70 percent of world GDP in the 17th century. The Mughal economy functioned on an elaborate system of coined currency, land revenue and trade. Gold, silver and copper coins were issued by the royal mints which functioned on the basis of free coinage.[126] The political stability and uniform revenue policy resulting from a centralized administration under the Mughals, coupled with a well-developed internal trade network, ensured that India–before the arrival of the British–was to a large extent economically unified, despite having a traditional agrarian economy characterised by a predominance of subsistence agriculture.[127] Agricultural production increased under Mughal agrarian reforms,[125] with Indian agriculture being advanced compared to Europe at the time, such as the widespread use of the seed drill among Indian peasants before its adoption in European agriculture,[128] and possibly higher per-capita agricultural output and standards of consumption than 17th century Europe.[129]
The Mughal Empire had a thriving industrial manufacturing economy, with India producing about 25% of the world's industrial output up until 1750,[130] making it the most important manufacturing center in international trade.[131] Manufactured goods and cash crops from the Mughal Empire were sold throughout the world. Key industries included textiles, shipbuilding, and steel, and processed exports included cotton textiles, yarns, thread, silk, jute products, metalware, and foods such as sugar, oils and butter.[125] Cities and towns boomed under the Mughal Empire, which had a relatively high degree of urbanization for its time, with 15% of its population living in urban centres, higher than the percentage of the urban population in contemporary Europe at the time and higher than that of British India in the 19th century.[132]
In early modern Europe, there was significant demand for products from Mughal India, particularly cotton textiles, as well as goods such as spices, peppers, indigo, silks, and saltpeter (for use in munitions).[125] European fashion, for example, became increasingly dependent on Mughal Indian textiles and silks. From the late 17th century to the early 18th century, Mughal India accounted for 95% of British imports from Asia, and the Bengal Subah province alone accounted for 40% of Dutch imports from Asia.[133] In contrast, there was very little demand for European goods in Mughal India, which was largely self-sufficient.[125] Indian goods, especially those from Bengal, were also exported in large quantities to other Asian markets, such as Indonesia and Japan.[134] At the time, Mughal Bengal was the most important center of cotton textile production.[135]
In the early 18th century the Mughal Empire declined, as it lost western, central and parts of south and north India to the Maratha Empire, which integrated and continued to administer those regions.[136] The decline of the Mughal Empire led to decreased agricultural productivity, which in turn negatively affected the textile industry.[137] The subcontinent's dominant economic power in the post-Mughal era was the Bengal Subah in the east., which continued to maintain thriving textile industries and relatively high real wages. However, the former was devastated by the Maratha invasions of Bengal and then British colonization in the mid-18th century. After the loss at the Third Battle of Panipat, the Maratha Empire disintegrated into several confederate states, and the resulting political instability and armed conflict severely affected economic life in several parts of the country – although this was mitigated by localised prosperity in the new provincial kingdoms. By the late eighteenth century, the British East India Company had entered the Indian political theatre and established its dominance over other European powers. This marked a determinative shift in India's trade, and a less-powerful effect on the rest of the economy.
British era (1793–1947)

From the beginning of the 19th century, the British East India Company's gradual expansion and consolidation of power brought a major change in taxation and agricultural policies, which tended to promote commercialisation of agriculture with a focus on trade, resulting in decreased production of food crops, mass impoverishment and destitution of farmers, and in the short term, led to numerous famines.[144] The economic policies of the British Raj caused a severe decline in the handicrafts and handloom sectors, due to reduced demand and dipping employment. After the removal of international restrictions by the Charter of 1813, Indian trade expanded substantially with steady growth. The result was a significant transfer of capital from India to Britain, which, due to the colonial policies of the British, led to a massive drain of revenue rather than any systematic effort at modernisation of the domestic economy. The economy of the Indian subcontinent was the largest in the world for most of recorded history up until the onset of colonialism in early 19th century.

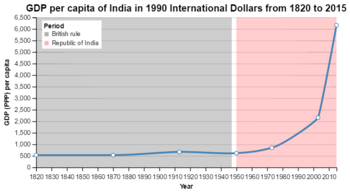
Under British rule, India's share of the world economy declined from 24.4% in 1700 down to 4.2% in 1950. India's GDP (PPP) per capita was stagnant during the Mughal Empire and began to decline prior to the onset of British rule.[148] India's share of global industrial output declined from 25% in 1750 down to 2% in 1900.[130] At the same time, Britain's share of the world economy rose from 2.9% in 1700 up to 9% in 1870. The British East India Company, following their conquest of Bengal in 1757, had forced open the large Indian market to British goods, which could be sold in India without tariffs or duties, compared to local Indian producers who were heavily taxed, while in Britain protectionist policies such as bans and high tariffs were implemented to restrict Indian textiles from being sold there, whereas raw cotton was imported from India without tariffs to British factories which manufactured textiles from Indian cotton and sold them back to the Indian market. British economic policies gave them a monopoly over India's large market and cotton resources.[156][157][158] India served as both a significant supplier of raw goods to British manufacturers and a large captive market for British manufactured goods.[159]
British territorial expansion in India throughout the 19th century created an institutional environment that, on paper, guaranteed property rights among the colonisers, encouraged free trade, and created a single currency with fixed exchange rates, standardised weights and measures and capital markets within the company-held territories. It also established a system of railways and telegraphs, a civil service that aimed to be free from political interference, a common-law, and an adversarial legal system.[160] This coincided with major changes in the world economy – industrialisation, and significant growth in production and trade. However, at the end of colonial rule, India inherited an economy that was one of the poorest in the developing world,[161] with industrial development stalled, agriculture unable to feed a rapidly growing population, a largely illiterate and unskilled labour force, and extremely inadequate infrastructure.[162]
The 1872 census revealed that 91.3% of the population of the region constituting present-day India resided in villages.[163] This was a decline from the earlier Mughal era, when 85% of the population resided in villages and 15% in urban centers under Akbar's reign in 1600.[164] Urbanisation generally remained sluggish in British India until the 1920s, due to the lack of industrialisation and absence of adequate transportation. Subsequently, the policy of discriminating protection (where certain important industries were given financial protection by the state), coupled with the Second World War, saw the development and dispersal of industries, encouraging rural-urban migration, and in particular, the large port cities of Bombay, Calcutta and Madras grew rapidly. Despite this, only one-sixth of India's population lived in cities by 1951.[165]
The effect of British rule on India's economy is a controversial topic. Leaders of the Indian independence movement and economic historians have blamed colonial rule for India's poor economic performance following independence and argued that the capital required for the Industrial Revolution in Britain came from India. At the same time, other historians have countered that India's poor economic performance was due to various sectors being in a state of growth and decline due to changes brought in by colonialism and a world that was moving towards industrialisation and economic integration.[166]
Several economic historians have argued that Indian real wages declined in the early 19th century, or possibly beginning in the very late 18th century, largely as a result of British colonial rule. According to Prasannan Parthasarathi and Sashi Sivramkrishna, the grain wages of Indian weavers were likely comparable to that of their British counterparts and their average income was around five times the subsistence level, which was comparable to advanced parts of Europe.[167][168] However they concluded that due to the scarcity of data, it was hard to draw definitive conclusions and that more research was required.[131][168] It has also been argued that India went through a period of deindustrialization in the latter half of the 18th century as an indirect outcome of the collapse of the Mughal Empire.[130]
Pre-liberalisation period (1947–1991)

Indian economic policy after independence was influenced by the colonial experience, which was seen as exploitative by Indian leaders exposed to the planned economy of the Soviet Union.[162] Domestic policy tended towards protectionism, with a strong emphasis on import substitution industrialisation, economic interventionism, a large government-run public sector, business regulation, and central planning,[169] while trade and foreign investment policies were relatively liberal.[170] Five-Year Plans of India resembled central planning in the Soviet Union. Steel, mining, machine tools, telecommunications, insurance, and power plants, among other industries, were effectively nationalised in the mid-1950s.[75] The Indian economy of this period is characterised as Dirigism.[63][64]

Jawaharlal Nehru, the first prime minister of India, along with the statistician Prasanta Chandra Mahalanobis, formulated and oversaw economic policy during the initial years of the country's independence. They expected favourable outcomes from their strategy, involving the rapid development of heavy industry by both public and private sectors, and based on direct and indirect state intervention, rather than the more extreme Soviet-style central command system.[174][175] The policy of concentrating simultaneously on capital- and technology-intensive heavy industry and subsidising manual, low-skill cottage industries was criticised by economist Milton Friedman, who thought it would waste capital and labour, and retard the development of small manufacturers.[176]
Since 1965, the use of high-yielding varieties of seeds, increased fertilisers and improved irrigation facilities collectively contributed to the Green Revolution in India, which improved the condition of agriculture by increasing crop productivity, improving crop patterns and strengthening forward and backward linkages between agriculture and industry.[177] However, it has also been criticised as an unsustainable effort, resulting in the growth of capitalistic farming, ignoring institutional reforms and widening income disparities.[178]
In 1984, Rajiv Gandhi promised economic liberalization, he made V. P. Singh the finance minister, who tried to reduce tax evasion and tax receipts rose due to this crackdown although taxes were lowered. This process lost its momentum during the later tenure of Mr. Gandhi as his government was marred by scandals.
Post-liberalisation period (since 1991)
The collapse of the Soviet Union, which was India's major trading partner, and the Gulf War, which caused a spike in oil prices, resulted in a major balance-of-payments crisis for India, which found itself facing the prospect of defaulting on its loans.[179] India asked for a $1.8 billion bailout loan from the International Monetary Fund (IMF), which in return demanded de-regulation.[180]
In response, the Narasimha Rao government, including Finance Minister Manmohan Singh, initiated economic reforms in 1991. The reforms did away with the Licence Raj, reduced tariffs and interest rates and ended many public monopolies, allowing automatic approval of foreign direct investment in many sectors.[181] Since then, the overall thrust of liberalisation has remained the same, although no government has tried to take on powerful lobbies such as trade unions and farmers, on contentious issues such as reforming labour laws and reducing agricultural subsidies.[182] This has been accompanied by increases in life expectancy, literacy rates, and food security, although urban residents have benefited more than rural residents.[183]


From 2010, India has risen from ninth-largest to the fifth-largest economies in the world by nominal GDP in 2019 by surpassing UK, France, Italy and Brazil.[184]
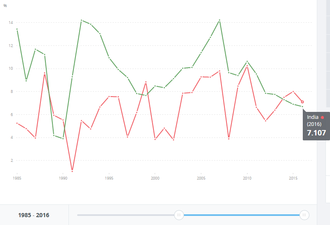
India started recovery in 2013–14 when the GDP growth rate accelerated to 6.4% from the previous year's 5.5%. The acceleration continued through 2014–15 and 2015–16 with growth rates of 7.5% and 8.0% respectively. For the first time since 1990, India grew faster than China which registered 6.9% growth in 2015.[needs update] However the growth rate subsequently decelerated, to 7.1% and 6.6% in 2016–17 and 2017–18 respectively,[185] partly because of the disruptive effects of 2016 Indian banknote demonetisation and the Goods and Services Tax (India).[186]
India is ranked 63rd out of 190 countries in the World Bank's 2020 ease of doing business index, up 14 points from the last year's 100 and up 37 points in just two years.[187] In terms of dealing with construction permits and enforcing contracts, it is ranked among the 10 worst in the world, while it has a relatively favourable ranking when it comes to protecting minority investors or getting credit.[188] The strong efforts taken by the Department of Industrial Policy and Promotion (DIPP) to boost ease of doing business rankings at the state level is said to affect the overall rankings of India.[189]
COVID-19 pandemic and aftermath (2020–present)
During the COVID-19 pandemic, numerous rating agencies downgraded India's GDP predictions for FY21 to negative figures,[190][191] signalling a recession in India, the most severe since 1979.[192][193] The Indian Economy contracted by 6.6 percent which was lower than the estimated 7.3 percent decline.[194] In 2022, the ratings agency Fitch Ratings upgraded India's outlook to stable similar to S&P Global Ratings and Moody's Investors Service's outlooks.[195] In the first quarter of financial year 2022–2023, the Indian economy grew by 13.5%.


Comments
Post a Comment